Introduction to Farm Data Visualization
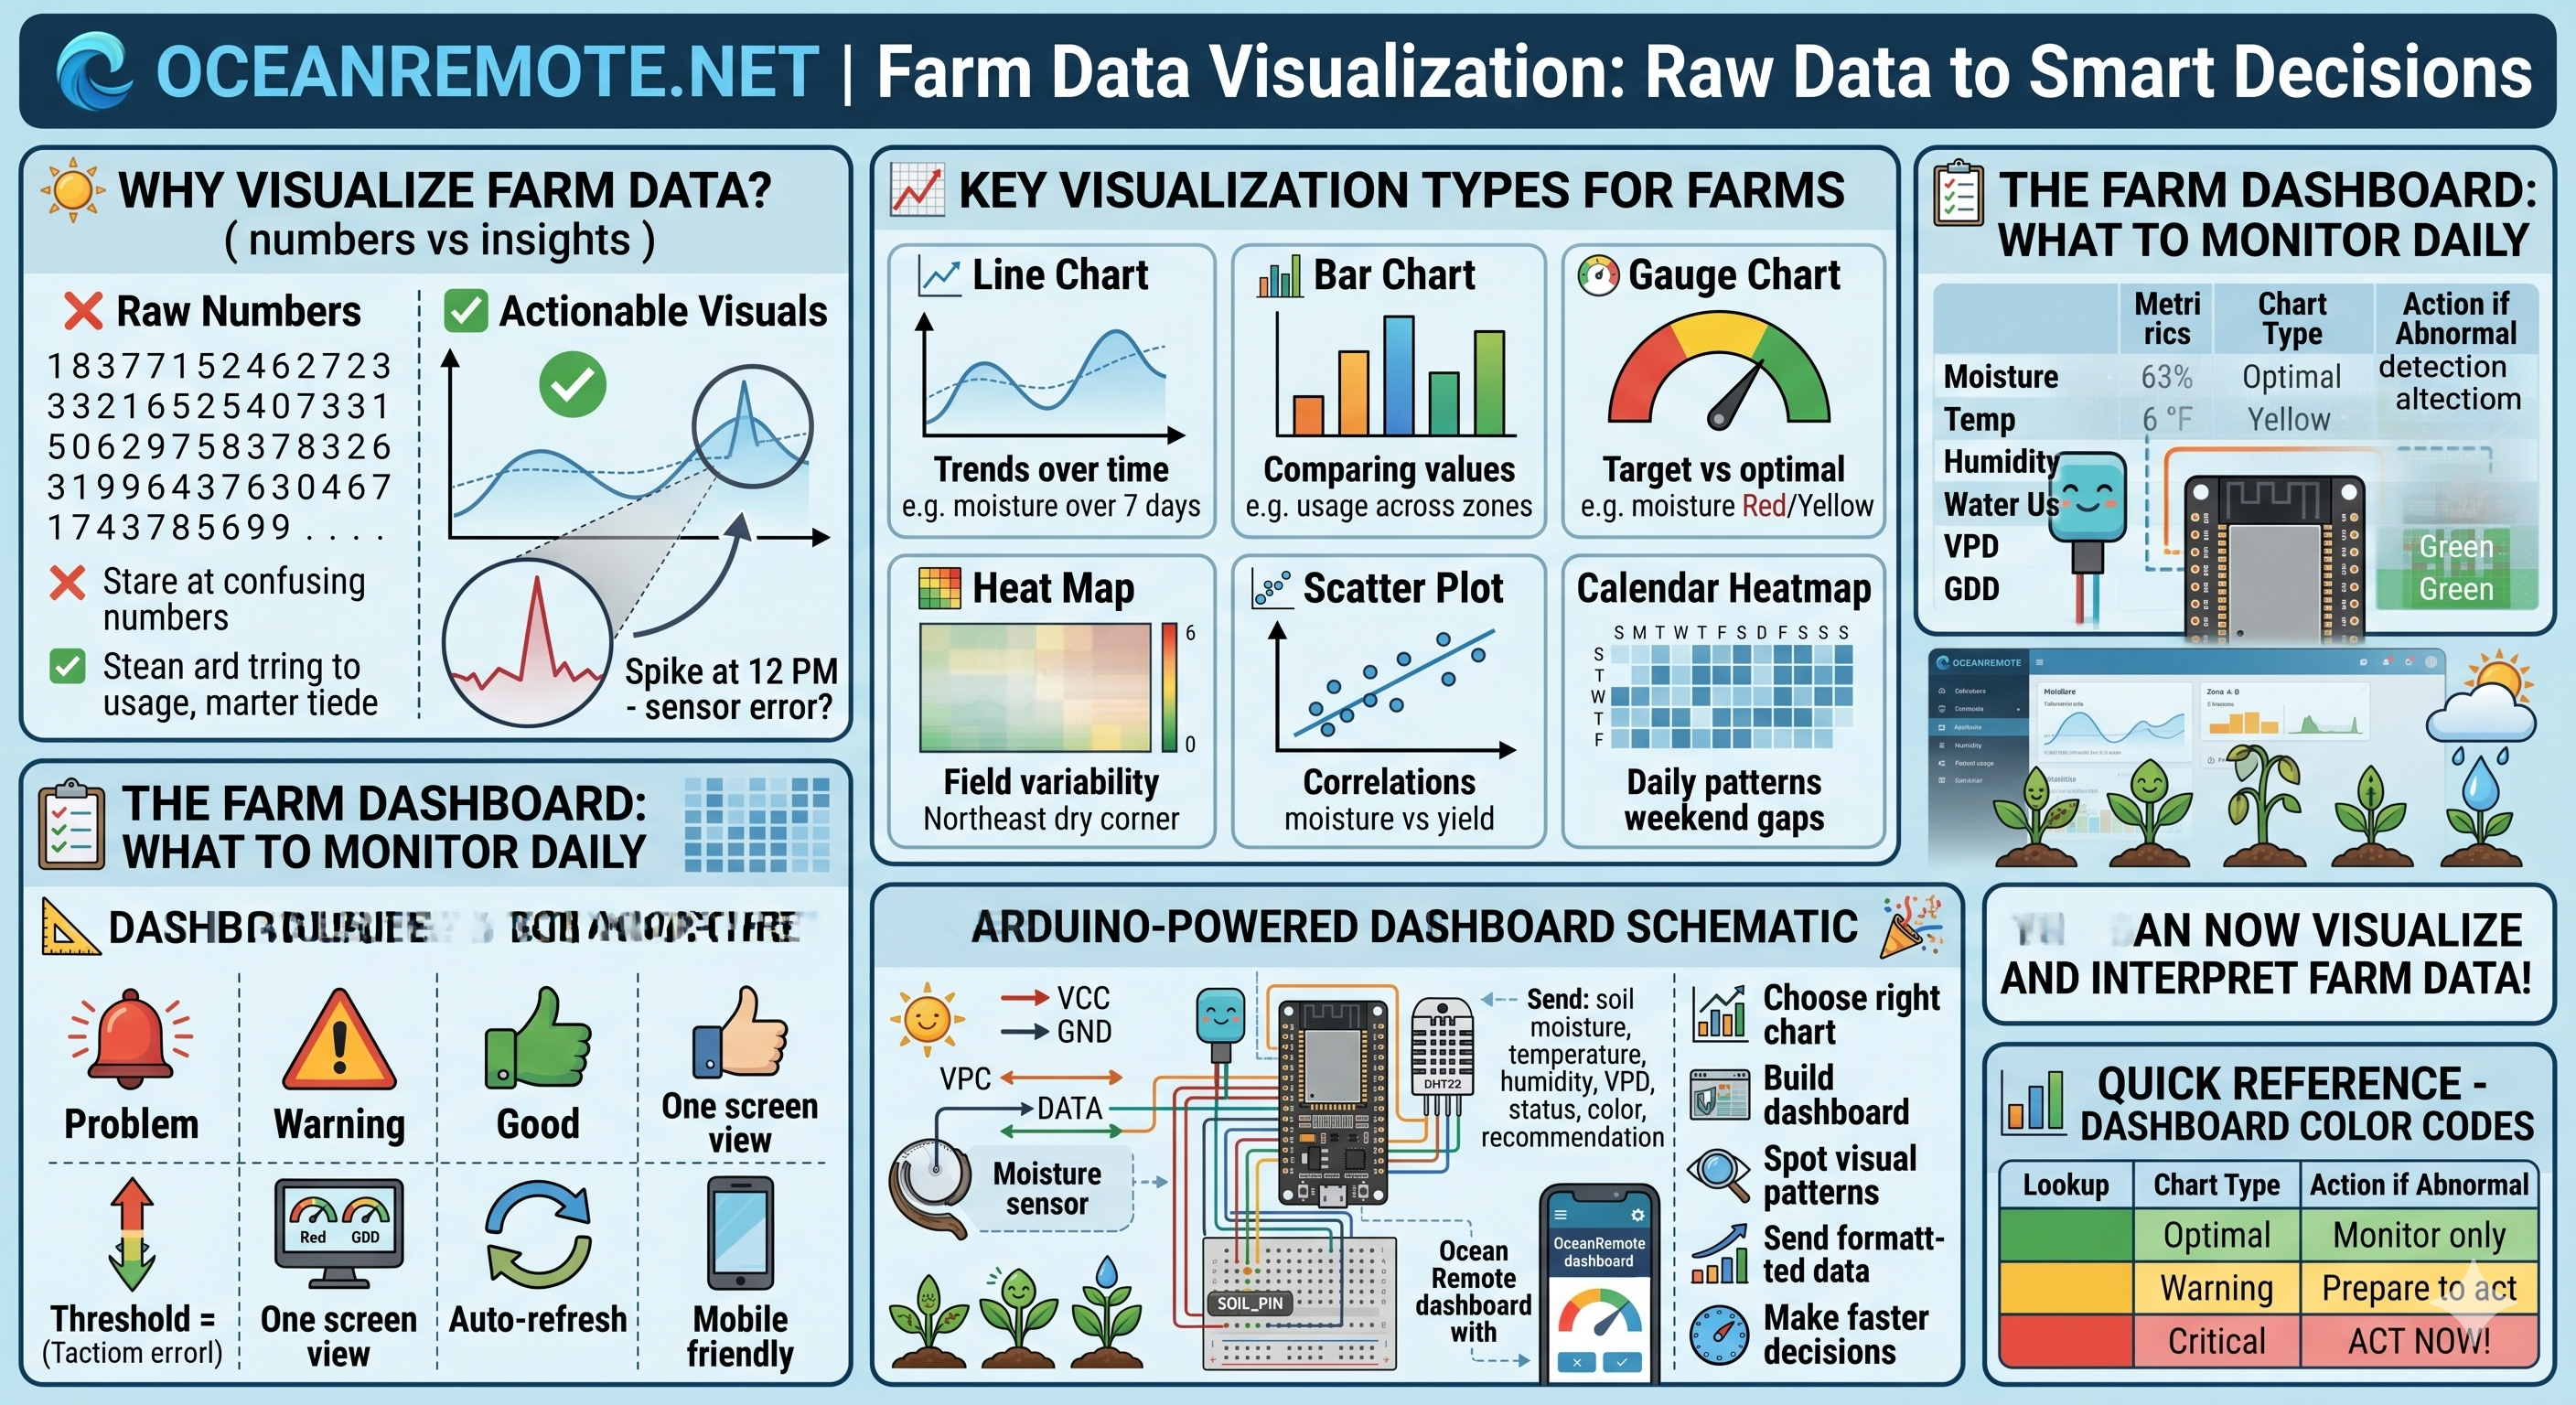
📊 Farm Data Visualization - From Raw Numbers to Smart Decisions
📈 What You'll Learn in This Lesson:
- 📊 Turn raw sensor data into actionable visual insights
- 📈 Choose the right chart type for each farm decision
- ⚠️ Spot problems instantly with visual pattern recognition
- 💰 Save water and increase yields using data visualization
- 🌾 Build your own farm dashboard from scratch
🌟 Why Visualize Farm Data?
| Without Visualization | With Visualization |
|---|---|
| ❌ Stare at confusing numbers: "45, 47, 46, 44, 73, 42..." | ✅ See instantly: "Spike at 12 PM - sensor error?" |
| ❌ Hard to spot gradual drying trends | ✅ Line chart shows "moisture dropping 5% daily" |
| ❌ Can't compare zones easily | ✅ Bar chart: "Zone A is drier than Zone B" |
| ❌ Workers struggle to understand data | ✅ Green = good, Red = problem - everyone understands! |
Your brain processes visual information 60,000x faster than text. A well-designed chart can communicate in seconds what would take minutes to explain with numbers!
📊 Key Visualization Types for Farms
Line Chart
Best for: Trends over time
Shows how moisture, temperature, or humidity changes across hours, days, or seasons.
Bar Chart
Best for: Comparing values
Compare water usage across zones, yields by crop type, or moisture between fields.
Gauge Chart
Best for: Single value vs target
Shows current reading against optimal range - red/yellow/green zones.
Heat Map
Best for: Field variability
Color-coded map shows which parts of your field are dry, wet, or optimal.
Scatter Plot
Best for: Correlations
Shows relationship between two variables - moisture vs yield, temperature vs growth.
Calendar Heatmap
Best for: Daily patterns
Color-coded calendar shows daily irrigation amounts or moisture levels.
📋 The Farm Dashboard: What to Monitor Daily
| Metric | Chart Type | What to Look For | Action if Abnormal |
|---|---|---|---|
| 💧 Soil Moisture | Line + Gauge | Dropping below 35% or spiking above 80% | Irrigate if dry, check drainage if wet |
| 🌡️ Temperature | Line Chart | Daily peaks >35°C or night temps >25°C | Increase ventilation, shade cloth |
| 💧 Humidity | Line Chart | >85% (mold risk) or <30% (stress) | Ventilate if humid, mist if dry |
| 💧 Water Usage | Bar Chart | Sudden spike or zone imbalance | Check for leaks, adjust schedule |
| 📊 VPD | Line + Gauge | Outside 0.8-1.2 kPa range | Adjust temp/humidity |
| 🌾 GDD Accumulation | Progress Bar | Behind schedule vs expected | Adjust harvest expectations |
🎨 Dashboard Design Best Practices
📐 Rules for Effective Farm Dashboards:
- 🔴 RED = Problem: Moisture <30%, Temperature >38°C, Humidity >85%
- 🟡 YELLOW = Warning: Moisture 30-40%, Temperature 32-38°C
- 🟢 GREEN = Good: Moisture 40-70%, Temperature 20-30°C
- 📏 One screen view: Most important metrics visible without scrolling
- 🔄 Auto-refresh: Update every 5-15 minutes for real-time monitoring
- 📱 Mobile friendly: Check from your phone anywhere on the farm
💻 Arduino Code: Send Formatted Data for Visualization
/* * Farm Data Logger for Visualization * Formats data for dashboard display * * Sends: soil moisture, temperature, humidity, VPD, timestamp * Compatible with OceanRemote dashboard */ #include#include #include #include #define DHTPIN 4 #define DHTTYPE DHT22 #define SOIL_PIN 32 DHT dht(DHTPIN, DHTTYPE); // WiFi credentials const char* ssid = "YOUR_WIFI"; const char* password = "YOUR_PASSWORD"; // OceanRemote API const char* token = "YOUR_DEVICE_TOKEN"; const char* apiEndpoint = "https://api.oceanremote.net/device/state"; // Sensor calibration const int DRY_VALUE = 3800; const int WET_VALUE = 1500; // Data storage for charts const int MAX_READINGS = 168; // Store 7 days of hourly data float moistureHistory[MAX_READINGS]; float tempHistory[MAX_READINGS]; float humidityHistory[MAX_READINGS]; int historyIndex = 0; int historyCount = 0; // Calculate VPD (Vapor Pressure Deficit) float calculateVPD(float temp, float humidity) { float es = 0.6108 * exp((17.27 * temp) / (temp + 237.3)); float ea = es * (humidity / 100.0); return es - ea; } // Read soil moisture percentage int readSoilMoisture() { int raw = analogRead(SOIL_PIN); int percentage = map(raw, DRY_VALUE, WET_VALUE, 0, 100); return constrain(percentage, 0, 100); } // Determine status color for dashboard String getStatusColor(int moisture) { if (moisture < 30) return "red"; if (moisture < 40) return "yellow"; return "green"; } // Get recommendation text String getRecommendation(int moisture, float temp, float vpd, float humidity) { if (moisture < 30) { return "🚨 CRITICAL: Soil too dry - Irrigate immediately!"; } else if (moisture < 40) { return "⚠️ WARNING: Soil drying - Plan irrigation today"; } else if (moisture > 80) { return "⚠️ WARNING: Soil too wet - Stop irrigation, check drainage"; } if (temp > 38) { return "🔥 HEAT STRESS: Increase ventilation, provide shade"; } else if (temp > 32) { return "☀️ High temperature - Monitor closely"; } if (humidity > 85) { return "💧 HIGH HUMIDITY: Risk of mold - Ventilate immediately"; } else if (humidity < 30) { return "🌵 LOW HUMIDITY: Plants stressed - Consider misting"; } if (vpd < 0.4) { return "💚 LOW VPD: Mold risk - Increase ventilation"; } else if (vpd > 1.5) { return "🔥 HIGH VPD: Plants closing stomata - Increase humidity"; } return "✅ OPTIMAL: All conditions normal"; } // Send data to OceanRemote dashboard void sendToCloud(int moisture, float temp, float humidity, float vpd) { if (WiFi.status() != WL_CONNECTED) return; HTTPClient http; http.begin(apiEndpoint); http.addHeader("Content-Type", "application/x-www-form-urlencoded"); String data = "token=" + String(token); data += "&soil_moisture=" + String(moisture); data += "&temperature=" + String(temp); data += "&humidity=" + String(humidity); data += "&vpd=" + String(vpd); data += "&status=" + getStatusColor(moisture); data += "&recommendation=" + getRecommendation(moisture, temp, vpd, humidity); int httpCode = http.POST(data); if (httpCode == 200) { Serial.println("✅ Data sent to dashboard"); } http.end(); } // Generate dashboard HTML for local display (no cloud needed) void generateLocalDashboard(int moisture, float temp, float humidity, float vpd) { Serial.println("\n╔════════════════════════════════════════════════════════════════╗"); Serial.println("║ 🌾 FARM DASHBOARD ║"); Serial.println("║ " + String(__TIME__) + " ║"); Serial.println("╠════════════════════════════════════════════════════════════════╣"); // Soil moisture gauge Serial.print("║ 💧 SOIL MOISTURE: "); Serial.print(moisture); Serial.print("% "); int bars = moisture / 10; for (int i = 0; i < 10; i++) { if (i < bars) Serial.print("█"); else Serial.print("░"); } Serial.println(" ║"); // Temperature Serial.print("║ 🌡️ TEMPERATURE: "); Serial.print(temp, 1); Serial.println("°C ║"); // Humidity Serial.print("║ 💧 HUMIDITY: "); Serial.print(humidity, 1); Serial.println("% ║"); // VPD Serial.print("║ 📊 VPD: "); Serial.print(vpd, 2); Serial.println(" kPa ║"); Serial.println("╠════════════════════════════════════════════════════════════════╣"); Serial.println("║ 📋 RECOMMENDATION: ║"); Serial.println("║ " + getRecommendation(moisture, temp, vpd, humidity)); Serial.println("╚════════════════════════════════════════════════════════════════╝\n"); } // Store data for history charts void storeHistory(int moisture, float temp, float humidity) { moistureHistory[historyIndex] = moisture; tempHistory[historyIndex] = temp; humidityHistory[historyIndex] = humidity; historyIndex = (historyIndex + 1) % MAX_READINGS; if (historyCount < MAX_READINGS) historyCount++; } void setup() { Serial.begin(115200); dht.begin(); // Connect to WiFi WiFi.begin(ssid, password); while (WiFi.status() != WL_CONNECTED) { delay(500); Serial.print("."); } Serial.println("\n✅ WiFi connected!"); Serial.println("═══════════════════════════════════════════"); Serial.println("📊 FARM DATA VISUALIZATION DASHBOARD"); Serial.println(" Real-time monitoring system"); Serial.println("═══════════════════════════════════════════\n"); } void loop() { // Read sensors int moisture = readSoilMoisture(); float temp = dht.readTemperature(); float humidity = dht.readHumidity(); float vpd = calculateVPD(temp, humidity); // Validate readings if (isnan(temp) || isnan(humidity)) { Serial.println("⚠️ Sensor error - retrying..."); delay(2000); return; } // Store history storeHistory(moisture, temp, humidity); // Display dashboard generateLocalDashboard(moisture, temp, humidity, vpd); // Send to cloud sendToCloud(moisture, temp, humidity, vpd); // Display last 24 hours trend if (historyCount >= 24) { float morningAvg = 0, eveningAvg = 0; for (int i = 0; i < 24; i++) { int idx = (historyIndex - 1 - i + MAX_READINGS) % MAX_READINGS; if (i < 6) eveningAvg += moistureHistory[idx]; // Last 6 hours if (i >= 18) morningAvg += moistureHistory[idx]; // 18-24 hours ago } morningAvg /= 6; eveningAvg /= 6; Serial.print("📈 TREND: "); if (eveningAvg < morningAvg - 5) { Serial.println("Moisture decreasing → Time to irrigate"); } else if (eveningAvg > morningAvg + 5) { Serial.println("Moisture increasing → Reduce irrigation"); } else { Serial.println("Moisture stable → Maintain schedule"); } } delay(3600000); // Send every hour }
📱 OceanRemote Dashboard Features
🌐 Your OceanRemote Dashboard Includes:
- 📊 Real-time gauges for soil moisture, temperature, humidity
- 📈 Interactive line charts showing 7-day or 30-day trends
- 🎯 Threshold alerts - Get notified when moisture drops below 35%
- 📱 Mobile responsive - Check on your phone from anywhere
- 📊 Historical data export - Download CSV for advanced analysis
- 🤖 Automation rules - Trigger irrigation based on dashboard thresholds
A South African fruit farmer installed soil moisture sensors across 20 hectares:
- 📊 Dashboard showed: Northwest zone consistently 20% drier than rest
- 🔍 Investigation found: Clogged drip emitters in that zone
- 💰 Savings: Fixed emitters → yield increased 40% in that zone
- 📈 ROI: Dashboard paid for itself in 2 weeks
"Without the visual dashboard, we would have never noticed the uneven watering. Now we check our charts every morning!" - Farm Manager, South Africa
- 📍 Check daily at the same time: Morning (7-8 AM) is best before irrigation decisions
- 📍 Share with your team: Put a tablet in the farm office showing the dashboard
- 📍 Set up mobile alerts: Get SMS when moisture drops below threshold
- 📍 Track over seasons: Compare this year's data to last year's
- 📍 Take screenshots: Document problems when they happen for later analysis
You can now visualize and interpret farm data like a pro!
- ✅ Choose the right chart type for each farm metric
- ✅ Build a complete Arduino-powered dashboard
- ✅ Spot problems instantly using visual patterns
- ✅ Send formatted data to OceanRemote for visualization
- ✅ Make faster, better decisions with visual insights
Next step: Set up automated alerts and integrate weather forecasts!
┌─────────────────────────────────────────────────────────────────────────────┐
│                         DASHBOARD COLOR CODE GUIDE                          │
├─────────────────────────────────────────────────────────────────────────────┤
│                                                                             │
│  🟢 GREEN (Optimal)        🟡 YELLOW (Warning)       🔴 RED (Critical)      │
│  ════════════════════      ════════════════════      ═══════════════════   │
│  Moisture: 40-70%          Moisture: 30-40%          Moisture: < 30%       │
│  Temp: 20-28°C             Temp: 28-32°C             Temp: > 35°C           │
│  Humidity: 40-70%          Humidity: 70-85%          Humidity: > 85%        │
│  VPD: 0.8-1.2 kPa          VPD: 1.2-1.5 kPa          VPD: > 1.5 kPa         │
│                                                                             │
│  ACTION: Monitor only      ACTION: Prepare to act    ACTION: ACT NOW!       │
│                                                                             │
└─────────────────────────────────────────────────────────────────────────────┘
- Apply these concepts directly to your farm or project.
- Take notes on important details for the quiz.
- Use the button below to track your progress.