← Back to Course
Practical Data Analysis
📈 Making Better Farming Decisions with Soil Data
📊 What You'll Learn:
- 🎯 Make data-driven irrigation decisions using soil moisture and temperature
- 💧 Calculate real water savings (typically 30-50%)
- 📈 Track yield improvements from proper watering
- 📁 Export and analyze your farm data for reporting
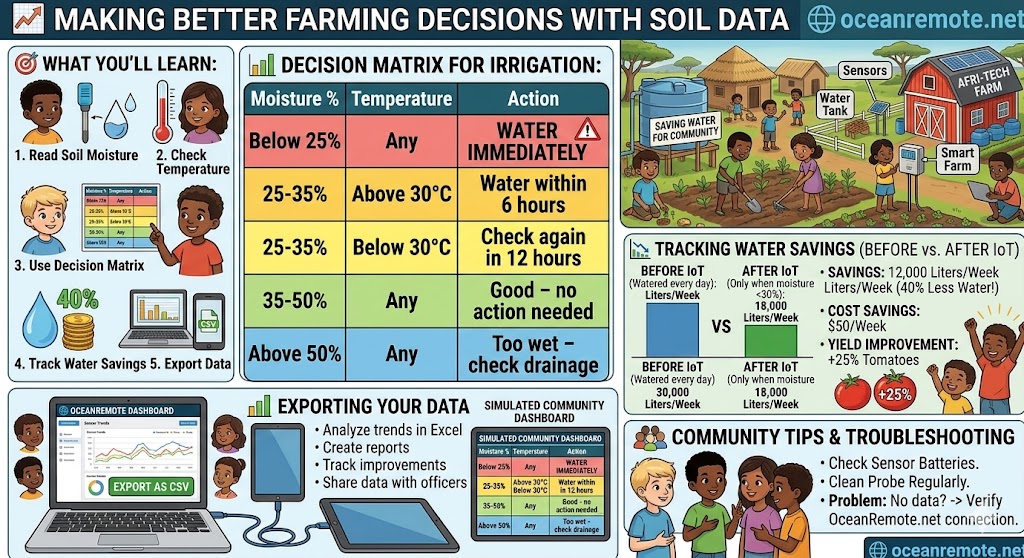
🎯 Decision Matrix for Irrigation
-
⚠️ CRITICAL: Below 25% moisture
→ WATER IMMEDIATELY — Plants at risk of permanent wilting
📉 Yield loss if delayed: 15-30% -
🌡️ 25-35% moisture + Temperature > 30°C
→ Water within 6 hours — Heat accelerates drying
💧 Evaporation rate: 30-50% higher in heat -
🌿 25-35% moisture + Temperature ≤ 30°C
→ Check again in 12 hours — Moisture is adequate for now
✅ Plants can access water, no immediate stress -
✅ 35-50% moisture (Any temperature)
→ Good — no action needed — Optimal range for most crops
🌱 Ideal zone: 40-50% for tomatoes, 35-45% for maize -
💧 Above 50% moisture (Any temperature)
→ Too wet — check drainage — Risk of root rot and fungal diseases
⚠️ Above 70%: Stop watering immediately, improve drainage
💡 Pro Tip — Customize Thresholds by Crop:
- 🍅 Tomatoes: Water at 30%, stop at 60% (optimal: 40-55%)
- 🌽 Maize/Corn: Water at 25%, stop at 55% (optimal: 35-50%)
- 🥬 Leafy greens: Water at 35%, stop at 70% (need consistent moisture)
- 🌶️ Peppers: Water at 25%, stop at 55% (drought-tolerant)
- 🥔 Potatoes: Water at 30%, stop at 65% (critical during tuber formation)
📉 Real Farm Savings with OceanRemote
-
⏰ BEFORE IoT: Watered every day regardless of need
→ 30,000 liters/week (fixed schedule, no soil data) -
✅ AFTER IoT: Watered only when moisture dropped below 30%
→ 18,000 liters/week (data-driven decisions) -
💧 WATER SAVINGS: 12,000 liters/week → 40% less water!
Annual savings: 624,000 liters (enough for 6 household swimming pools) -
💰 COST SAVINGS: $50/week → $2,600/year on water bills
Plus electricity savings for pumping: +$300-500/year -
📈 YIELD IMPROVEMENT: 25% more tomatoes (no over-watering stress)
Additional revenue: $2,000-5,000/year depending on farm size
📖 Case Study — 3-Year Data Tracking, Tanzania:
A 15-acre vegetable farm tracked soil data for 3 years using OceanRemote:
- 📊 Year 1 (baseline): Timer-based irrigation — 35,000L/week, $65/week water cost
- 📊 Year 2 (soil sensors): 21,000L/week (40% less), $39/week → saved $1,352
- 📊 Year 3 (soil + weather): 18,000L/week (48% less), $33/week → saved $1,664
- 📈 Yield increase: 32% over 3 years (reduced water stress)
- 💰 Total 3-year savings: $4,500 + $8,000 additional revenue = $12,500
"The data doesn't lie. I used to over-water constantly. Now I water only when the soil tells me to. My vegetables are healthier and my wallet is fuller." — Farmer, Arusha Region
📁 Exporting and Analyzing Your Data
-
📊 CSV Export
OceanRemote lets you export all sensor data as CSV files for analysis in Excel or Google Sheets -
📈 Trend Analysis
Track moisture patterns over weeks/months to identify optimal watering schedules -
📄 Custom Reports
Create professional reports for investors, cooperatives, or agricultural extension officers -
📉 Year-over-Year Comparison
Compare seasonal data to see improvements and plan for next growing season
💡 What to Track for Maximum ROI:
- 📊 Daily soil moisture — Identify drying patterns
- 🌡️ Soil temperature — Affects root growth and nutrient uptake
- 💧 Water used per irrigation cycle — Calculate true efficiency
- 📈 Yield per watering event — Find optimal moisture range
- 💰 Cost per liter of water saved — Prove ROI to investors
🌟 Sample Excel Analysis You Can Do:
1. Calculate average moisture by time of day
   → Water needs higher in afternoon (transpiration peaks)

2. Find correlation: Moisture drop vs. Temperature
   → Every 5°C increase = 10-15% faster drying

3. Identify optimal watering window
   → Most farms save 20% by watering at 6am vs 12pm

4. Track water savings over time
   → Compare month 1 vs month 6 vs month 12

5. Calculate cost per kg of produce
   → Lower water costs = higher profit margins
⚠️ Common Data Mistakes to Avoid:
- ❌ One sensor for entire farm: Soil varies across fields. Use 3-5 sensors per acre for accuracy
- ❌ Ignoring soil temperature: Cold soil (below 15°C) reduces water uptake — don't over-water
- ❌ Only checking moisture at surface: Roots grow 10-30cm deep. Measure at root depth!
- ❌ Not calibrating sensors: Different soil types (sandy vs clay) give different readings
- ❌ Watering at noon: 30-50% evaporates. Water at sunrise for best efficiency
🎯 Key Takeaways:
- ✅ Decision matrix: Below 25% = WATER NOW. 35-50% = optimal. Above 50% = too wet
- ✅ Typical savings: 30-50% water reduction = $1,000-3,000/year on a 10-acre farm
- ✅ Yield improvement: 15-30% increase from proper watering (no stress)
- ✅ Export data: CSV files let you analyze trends in Excel or Google Sheets
- ✅ Track ROI: Most farmers recoup IoT investment in 2-4 months
- ✅ Share insights: Data reports help secure grants or cooperative funding
- ✅ Continuous improvement: Year-over-year tracking shows clear progress
💡 Key Takeaways:
- Apply these concepts directly to your farm or project.
- Take notes on important details for the quiz.
- Use the button below to track your progress.
×
![Enlarged view]()