Data Analysis Basics
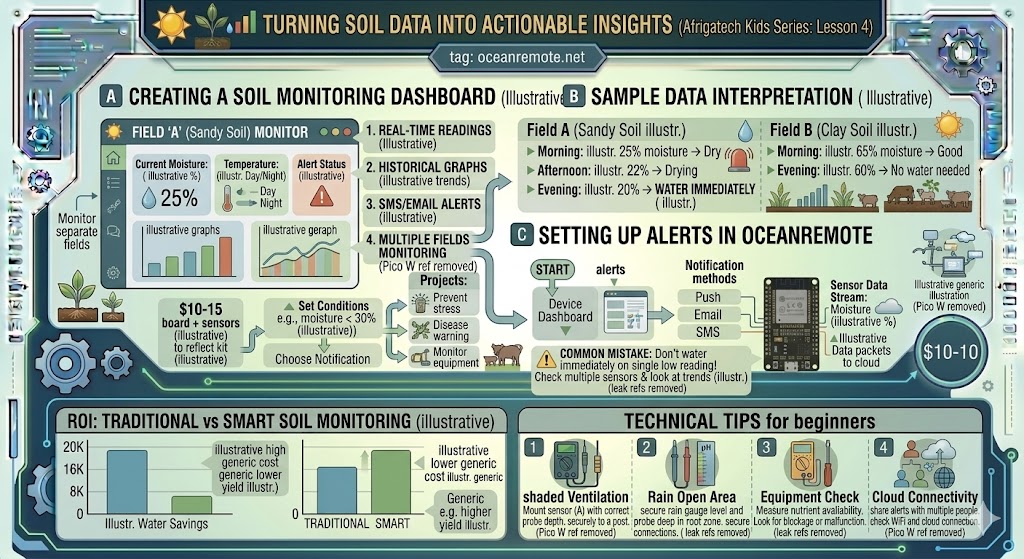
📊 Turning Soil Data into Actionable Insights - From Numbers to Farm Decisions
📊 What You'll Learn:
- 📈 Create a soil monitoring dashboard to visualize all your data
- 🚨 Set up alerts to get notified when thresholds are crossed
- 📊 Interpret sample data for different soil types (sandy vs clay)
- 📱 Monitor multiple fields separately from one dashboard
Raw soil data is just numbers until you interpret it. A good dashboard turns those numbers into visual insights - graphs, alerts, and trends that tell you exactly when to water, when to wait, and when to investigate problems.
📈 Creating a Soil Monitoring Dashboard with OceanRemote
With OceanRemote, you can see all your soil data in one place:
- 📊 Real-time readings: Current moisture, temperature, and humidity at a glance
- 📈 Historical graphs: See trends over days, weeks, or months - spot patterns
- 🚨 Alerts: Get SMS, email, or push notification when thresholds are crossed
- 🗺️ Multiple fields: Monitor different sections of your farm separately (Zone A, Zone B)
- 📤 Data export: Download CSV for advanced analysis in Excel
- Check your dashboard at the same time daily (morning is best)
- Compare multiple days to see trends, not just single readings
- Set up color coding: Green = good, Yellow = warning, Red = critical
- Share dashboard access with farm workers so everyone sees the same data
📊 Sample Data Interpretation - Sandy vs Clay Soil
Different soil types behave completely differently. Sandy soil drains fast and needs frequent irrigation. Clay soil holds water longer but waterlogs easily.
═══════════════════════════════════════════════════════════════════════════════
                    FIELD A: SANDY SOIL (Fast draining)
═══════════════════════════════════════════════════════════════════════════════

  Time        | Moisture | Interpretation           | Action
  ═════════════╪══════════╪══════════════════════════╪═══════════════════════════
  Morning     | 25%      | Below threshold (35%)    | Dry, needs water today
  Afternoon   | 22%      | Still dropping           | Drying fast - urgent
  Evening     | 20%      | CRITICAL below 25%       | WATER IMMEDIATELY!

  💡 Insight: Sandy soil loses 1-2% moisture per hour. Water every 1-2 days.

═══════════════════════════════════════════════════════════════════════════════
                    FIELD B: CLAY SOIL (Holds water)
═══════════════════════════════════════════════════════════════════════════════

  Time        | Moisture | Interpretation           | Action
  ═════════════╪══════════╪══════════════════════════╪═══════════════════════════
  Morning     | 65%      | Above threshold (50%)    | Good - no water needed
  Afternoon   | 63%      | Minimal drop (2%)        | Still good
  Evening     | 60%      | Above threshold          | No water needed

  💡 Insight: Clay soil holds water for 3-5 days. Water every 3-4 days.

═══════════════════════════════════════════════════════════════════════════════
Never water immediately when you see a single low reading. One sensor might have an error, or a dry patch might not represent the whole field. Check:
- At least 2-3 consecutive readings showing the same trend
- Multiple sensors in the same zone (average them)
- The trend over 6-12 hours, not just one moment
📱 Setting Up Alerts in OceanRemote
- Log in to your OceanRemote account
- Go to your Device Dashboard
- Click the "Alerts" tab for your soil sensor
- Click "Create New Alert"
- Set conditions: e.g., "Send alert when moisture below 30%"
- Choose notification method: SMS, Email, or Push Notification
- Set cooldown period (e.g., alert every 6 hours, not every minute)
- Click Save - you'll get alerts instantly when thresholds are crossed!
A pepper farmer in Ghana set up a soil moisture dashboard with alerts:
- 📊 Dashboard showed: Zone A consistently 10% drier than Zone B
- 🔧 Investigation found: Clogged drip emitters in Zone A
- 🚨 Alert triggered: 2 AM moisture dropped to 28%
- ✅ Action: Fixed emitters next morning
- 📈 Result: Even watering restored, yield increased 40% in that zone
"Without the dashboard and alerts, we would have lost the entire zone to drought stress." - Farm Manager, Ghana
- Name your sensors clearly: "North Field Tomatoes" vs "South Field Peppers"
- Set different thresholds per crop: Tomatoes (35%), Maize (30%), Onions (25%)
- Compare zones weekly: Is one zone consistently drier? Check irrigation coverage
- Track seasonal patterns: Compare this week to same week last year
- ✅ Dashboards turn raw numbers into visual insights - use them daily
- ✅ Sandy soil needs water every 1-2 days; clay soil every 3-5 days
- ✅ Never act on a single reading - look at trends over several hours
- ✅ Set up alerts for critical thresholds (moisture < 30%)
- ✅ Monitor multiple fields separately - they have different needs
Next lesson: Exporting and Analyzing Data in Excel
- Apply these concepts directly to your farm or project.
- Take notes on important details for the quiz.
- Use the button below to track your progress.