How Data Travels
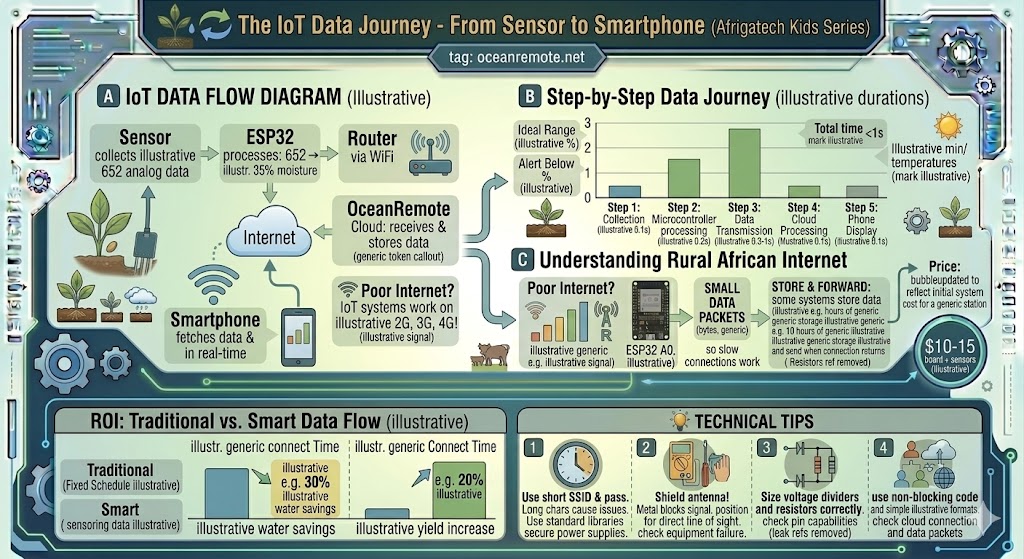
🔄 The IoT Data Journey - From Sensor to Smartphone in Under 1 Second
🔄 What You'll Learn:
- 📡 Understand the complete journey of sensor data - from field to phone
- ⚡ See how data travels in less than 1 second despite traveling thousands of kilometers
- 📶 Learn why IoT works even in rural Africa with poor internet
- 🔧 Understand each step: sensing, processing, transmitting, cloud, display
When you see soil moisture on your phone, that data has traveled from your field, through the air, across the internet, and back to your screen - all in less time than it takes to blink your eye. Understanding this journey helps you troubleshoot problems and appreciate the technology.
📡 Data Flow Diagram:
🌱 Sensor → 🖥️ ESP32 → 📡 WiFi Router → 🌐 Internet → ☁️ OceanRemote Cloud → 📱 Your Phone
⏱️ Total time: ~0.8 seconds | 📦 Data size: ~50 bytes
Step 1: Sensor Collection (0.1 seconds)
The sensor measures the physical world. A capacitive soil moisture sensor reads the dielectric constant of soil, which changes with water content. The sensor outputs an analog voltage between 0-3.3V.
- Example: Soil moisture sensor reads "652" from its analog pin (0-4095 range)
- Raw data: 652 (0-4095) → Higher value = drier soil
- Sensor types: Soil moisture, temperature (DS18B20), humidity (DHT22), rain sensor, etc.
- Speed: Most sensors read in 10-100 milliseconds
Step 2: Microcontroller Processing (0.2 seconds)
The ESP32 or ESP8266 reads the sensor value and converts it to meaningful data. This is where raw numbers become useful information.
- Conversion: "652" raw → "35% moisture" using calibration formula
- Adding metadata: Device ID (e.g., "sensor_01"), timestamp, battery level
- Decision making: Check if thresholds are crossed (e.g., moisture < 30% → trigger alert)
- Batching: Multiple sensors can be read in one cycle
Raw: analogRead(32) = 652
Calibration: map(652, 3800, 1500, 0, 100) = 35%
Final data: {"device":"sensor_01","moisture":35%,"time":"2025-05-11 08:00:00"}
Step 3: Data Transmission (0.3-1 second)
The data is sent via WiFi to the OceanRemote cloud platform. It travels through your router, your internet provider, and across the internet to our servers.
- WiFi connection: ESP32 connects to your 2.4GHz WiFi router
- HTTP POST request: Data sent as small packet (typically 50-200 bytes)
- Path: Field → Router → ISP → Internet → OceanRemote servers
- Distance: Your data may travel thousands of kilometers in milliseconds
A soil sensor in rural Kenya sends data to OceanRemote servers in Germany:
- 🌱 Origin: Nakuru, Kenya
- 📡 Router: Rural ISP via fiberoptic cable
- 🌍 Path: Kenya → Uganda → Sudan → Egypt → Mediterranean → Germany
- ⏱️ Travel time: 0.3-0.5 seconds
- ✅ Distance: ~6,000 kilometers, 1 second round trip
Data travels faster than you can blink! Light travels 300,000 km per second.
Step 4: Cloud Processing (0.1 seconds)
The OceanRemote server receives the data, validates it, stores it in the database, and checks if any alerts need to be triggered.
- Validation: Check if data is complete (device ID, timestamp, values present)
- Storage: Save to PostgreSQL database for historical tracking
- Alert checking: If moisture < 30%, trigger SMS/email/push notification
- Real-time update: Push to connected dashboards via WebSocket
Step 5: Your Phone Display (0.1 seconds)
When you open the OceanRemote dashboard, it fetches the latest data and shows it in real-time. The total time from sensor to your screen is less than 1 second!
- Dashboard fetch: Your phone requests latest data from cloud
- JSON response: Server sends back current and historical data
- Rendering: Phone app displays graphs, gauges, and alerts
- Auto-refresh: Dashboard updates automatically every 10-30 seconds
⏱️ Total time from sensor to screen: ~0.8 seconds!
Faster than a blink of an eye (0.1-0.4 seconds)
📶 What About Areas with Poor Internet?
IoT systems are designed for rural Africa! They work on 2G, 3G, and 4G networks. Data packets are very small (only a few bytes), so even slow connections work fine.
- Small data size: Each reading is only 50-200 bytes (compared to 2MB for a typical webpage)
- Offline storage: ESP32 can store up to 100 readings if WiFi fails, then send all at once when connection returns
- Low bandwidth: Works on 2G networks (as slow as 50kbps)
- Retry logic: If transmission fails, ESP32 retries up to 5 times
- SMS fallback: Critical alerts can be sent via SMS if internet is down
- 📊 Soil moisture reading: ~60 bytes
- 🌡️ Temperature + humidity reading: ~80 bytes
- 📱 Loading a webpage: ~2,000,000 bytes (2MB)
- 🎥 Watching YouTube for 1 minute: ~10,000,000 bytes (10MB)
- Conclusion: IoT data is extremely lightweight - perfect for slow networks!
- ❌ Data not updating: Check ESP32 power, WiFi connection, network coverage
- ❌ Missing readings in dashboard: Check if device is registered with correct token
- ❌ Delayed readings (minutes): Slow internet connection - normal, wait for retry
- ❌ No data for hours: ESP32 may be in deep sleep or battery dead
- ✅ Data travels from sensor → ESP32 → WiFi → Internet → Cloud → Your phone
- ✅ Total journey time: less than 1 second (faster than a blink)
- ✅ Each reading is only 50-200 bytes - works on slow 2G networks
- ✅ ESP32 can store offline data and send when connection returns
- ✅ Understanding the data journey helps you troubleshoot problems
Next lesson: Making Decisions from Data - Turning Numbers into Action
- Apply these concepts directly to your farm or project.
- Take notes on important details for the quiz.
- Use the button below to track your progress.