← Back to Course
Identifying Daily and Seasonal Patterns
📈 Identifying Farm Data Patterns - From Raw Data to Actionable Insights
🔍 What You'll Learn in This Lesson:
- 🌡️ Detect daily, weekly, and seasonal patterns in your farm data
- 📊 Use moving averages to smooth noisy sensor readings
- 🔮 Predict future conditions based on historical patterns
- 🚨 Identify anomalies before they become problems
- 💻 Build a pattern detection system with Arduino/ESP32
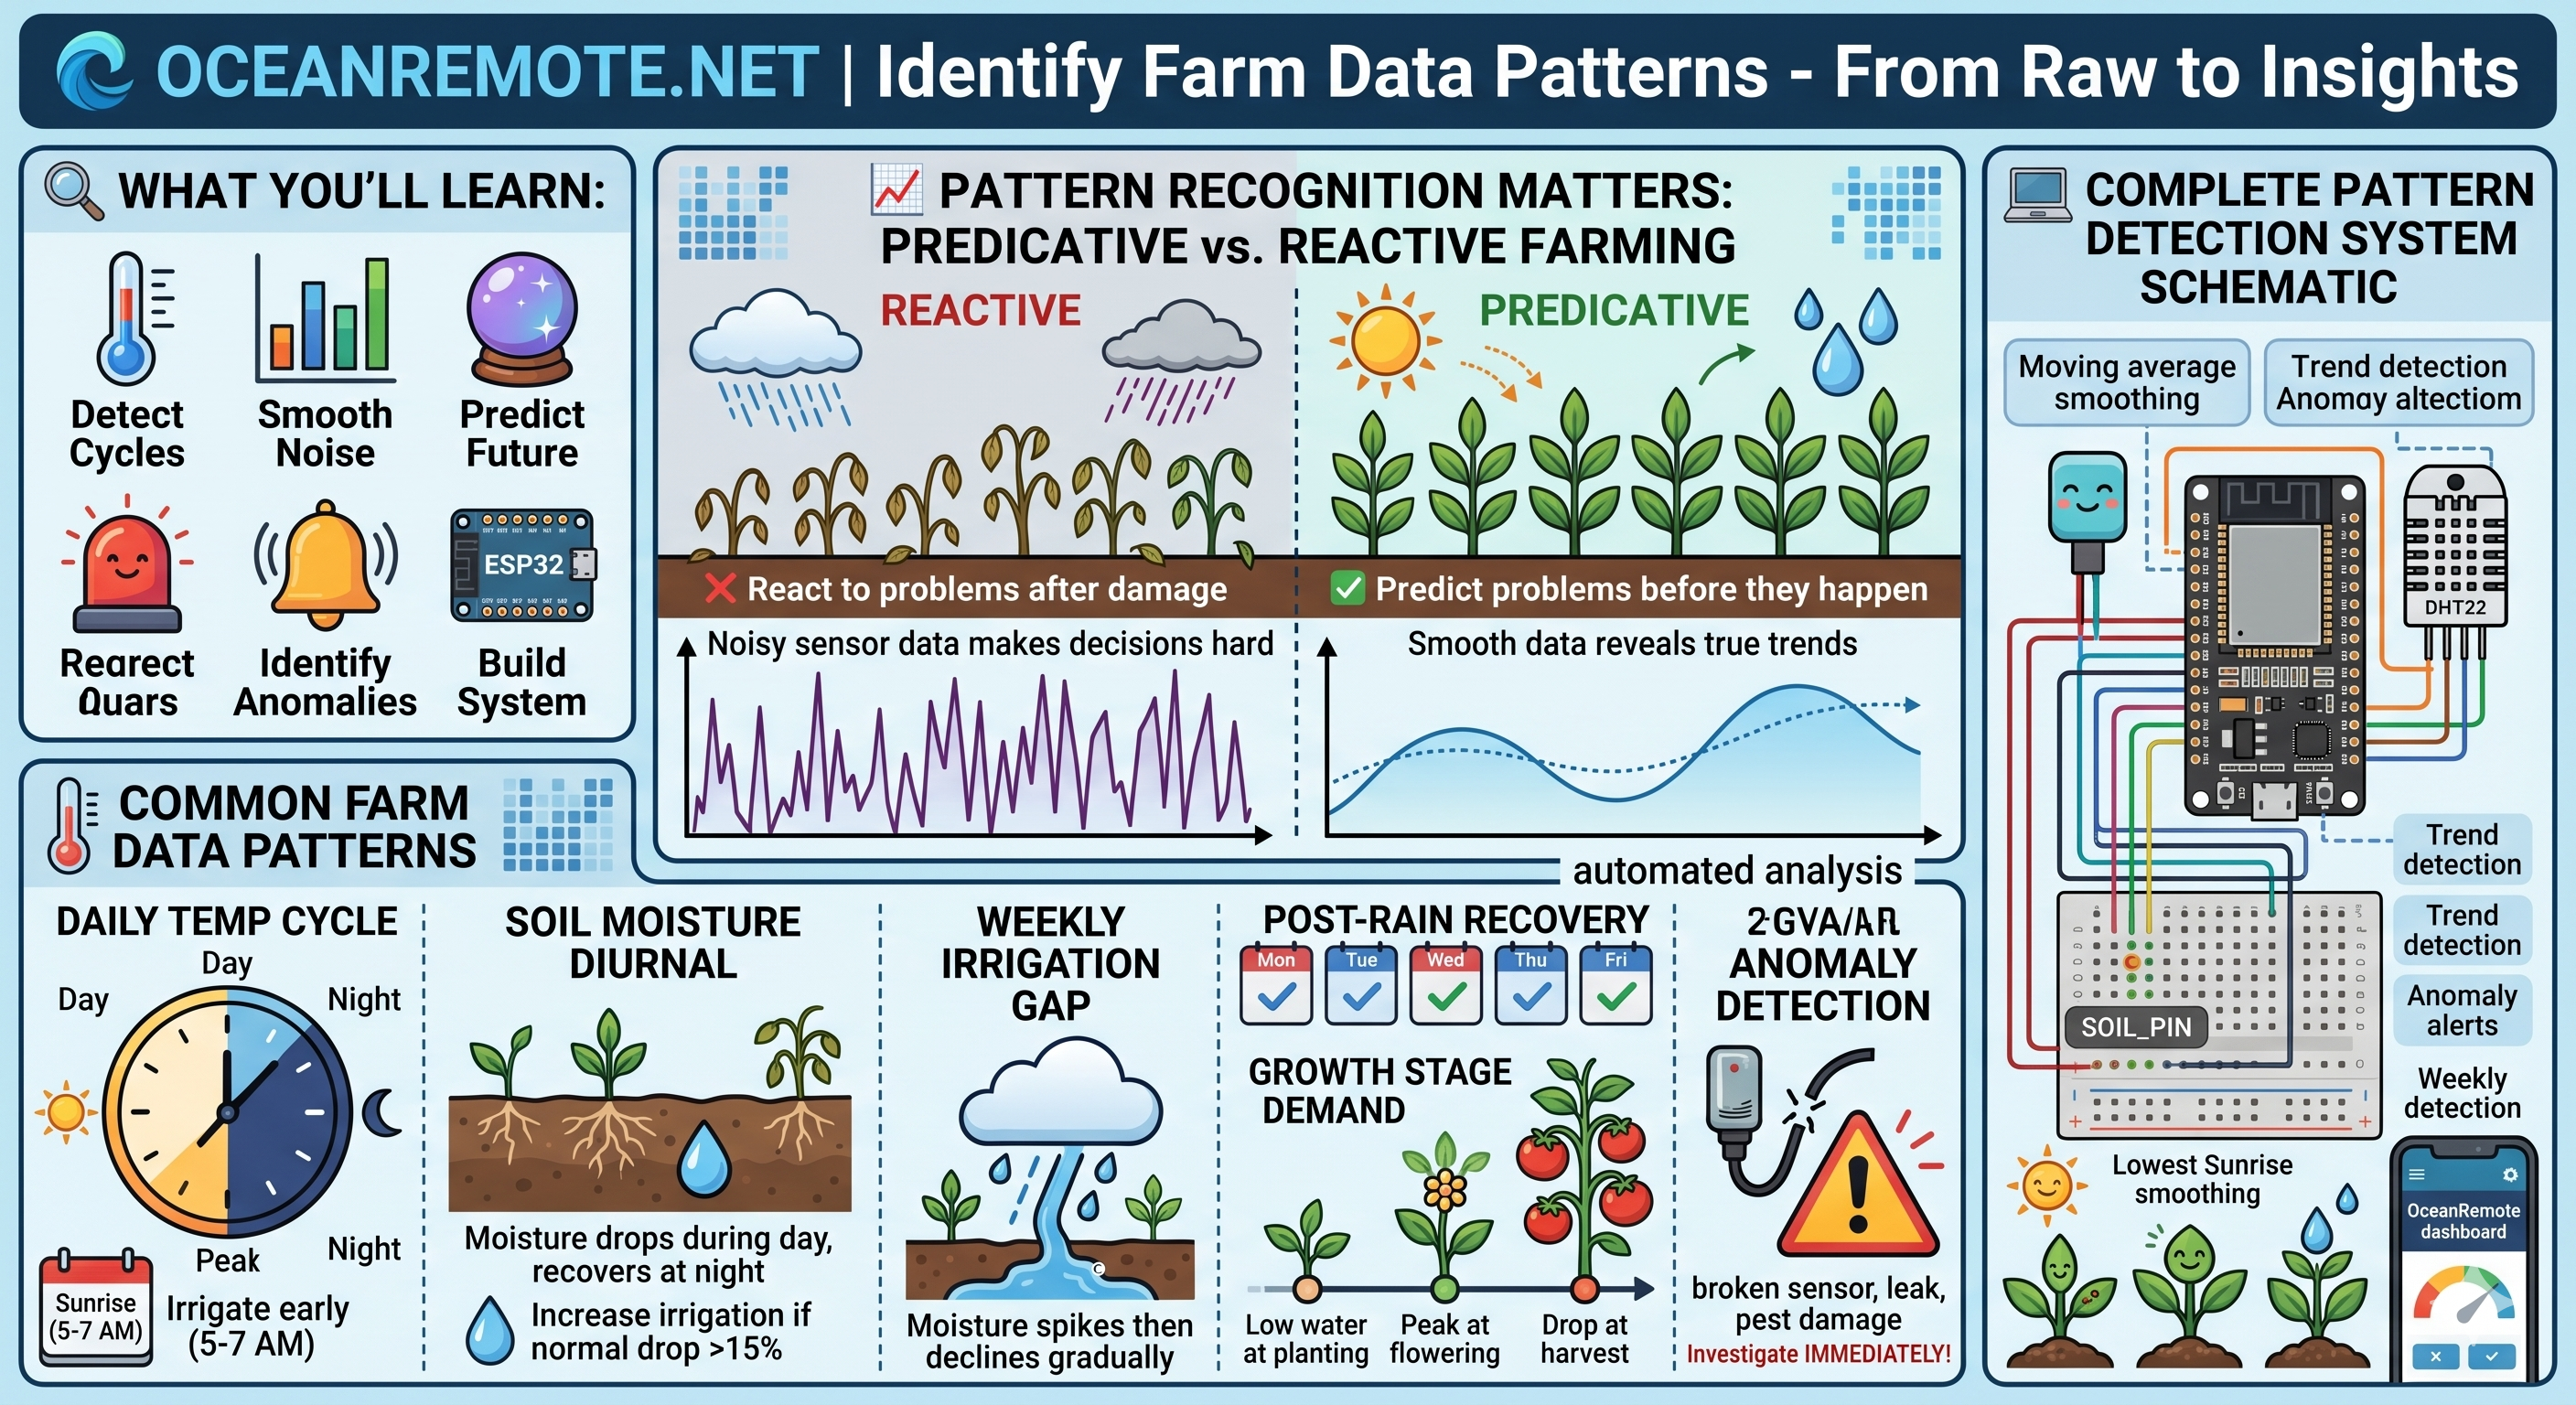
📊 Why Pattern Recognition Matters for Your Farm
| Without Pattern Recognition | With Pattern Recognition |
|---|---|
| ❌ React to problems after damage occurs | ✅ Predict problems before they happen |
| ❌ Noisy sensor data causes false readings | ✅ Smooth data reveals true trends |
| ❌ Can't distinguish real issues from normal variation | ✅ Know what's normal vs. abnormal |
| ❌ Manual analysis takes hours | ✅ Automated detection saves time |
📈 Common Farm Data Patterns
Daily Temperature Cycle
Pattern: Temperature lowest at sunrise (6-7 AM), peaks at 2-4 PM
Action: Irrigate early morning (5-7 AM) to reduce evaporation loss
Action: Irrigate early morning (5-7 AM) to reduce evaporation loss
Soil Moisture Diurnal Pattern
Pattern: Moisture drops during day (evaporation + transpiration), recovers at night
Action: Normal drop = 5-15% daily. Larger drop = increase irrigation
Action: Normal drop = 5-15% daily. Larger drop = increase irrigation
Weekly Irrigation Gap
Pattern: Monday moisture lower than Friday (weekend irrigation skipped)
Action: Automate irrigation or adjust weekend schedule
Action: Automate irrigation or adjust weekend schedule
Post-Rain Recovery
Pattern: Moisture spikes after rain, then gradual decline
Action: Soil should stay above threshold for 3-7 days after good rain
Action: Soil should stay above threshold for 3-7 days after good rain
Growth Stage Water Demand
Pattern: Low water at planting → Peak at flowering → Drop at harvest
Action: Plan irrigation schedule around crop development stages
Action: Plan irrigation schedule around crop development stages
Anomaly Detection
Pattern: Sudden drop/spike outside normal range = PROBLEM!
Action: Investigate immediately - broken sensor, leak, or pest damage
Action: Investigate immediately - broken sensor, leak, or pest damage
📊 Moving Average - Smoothing Noisy Data
💡 What is a Moving Average?
Raw sensor data often has random noise. A moving average smooths out these fluctuations so you can see the REAL trend.
Moving Average = (Value₁ + Value₂ + ... + Valueₙ) / N
| Time | Raw Sensor | 3-Point Moving Average | 5-Point Moving Average |
|---|---|---|---|
| 8:00 | 45 | - | - |
| 9:00 | 47 | - | - |
| 10:00 | 46 | 46.0 | - |
| 11:00 | 48 | 47.0 | - |
| 12:00 | 73 | 55.7 | 51.8 |
| 13:00 | 42 | 54.3 | 51.2 |
| 14:00 | 44 | 53.0 | 50.6 |
| 15:00 | 45 | - | 49.2 |
Notice how the 12:00 spike (73) is smoothed out - the 5-point average shows 51.8, much closer to reality!
📈 Trend Detection: Going Up or Down?
🔍 Linear Regression - Detecting Trends:
Simple trend detection: Compare today's average to 3-day average
- 📈 UP trend: Today's value > 3-day average (soil drying out)
- 📉 DOWN trend: Today's value < 3-day average (getting wetter)
- ➡️ STABLE: Within 5% of average (normal conditions)
💻 Arduino/ESP32 Code: Complete Pattern Detection System
/* * Farm Data Pattern Detection System * Detects daily cycles, weekly patterns, and anomalies * * Features: * - Moving average smoothing * - Trend detection (going up/down) * - Anomaly alerts * - Weekly pattern detection */ #include// ========== SENSOR CONFIGURATION ========== #define SOIL_PIN 32 #define TEMP_PIN 4 // ========== DATA STORAGE ========== const int MAX_HOURS = 168; // Store 7 days of data (24*7) float soilHistory[MAX_HOURS]; float tempHistory[MAX_HOURS]; int dataIndex = 0; int dataCount = 0; // ========== PATTERN DETECTION ========== struct DailyPattern { float morningAvg; // 5-7 AM float middayAvg; // 12-2 PM float eveningAvg; // 6-8 PM float nightAvg; // 10 PM - 4 AM }; // ========== READ SOIL MOISTURE ========== int readSoilMoisture() { int raw = analogRead(SOIL_PIN); // Calibrate these values for YOUR sensor! int percentage = map(raw, 3800, 1500, 0, 100); return constrain(percentage, 0, 100); } // ========== MOVING AVERAGE ========== float calculateMovingAverage(float* data, int windowSize) { if (dataCount < windowSize) return -1; float sum = 0; for (int i = dataCount - windowSize; i < dataCount; i++) { sum += data[i]; } return sum / windowSize; } // ========== DETECT PATTERNS ========== void detectDailyPattern() { if (dataCount < 24) return; DailyPattern pattern; pattern.morningAvg = 0; pattern.middayAvg = 0; pattern.eveningAvg = 0; pattern.nightAvg = 0; int morningCount = 0, middayCount = 0, eveningCount = 0, nightCount = 0; int currentHour = (millis() / 3600000) % 24; // Analyze last 24 hours for (int i = 0; i < 24; i++) { int hour = (currentHour - i + 24) % 24; float moisture = soilHistory[(dataIndex - 1 - i + MAX_HOURS) % MAX_HOURS]; if (hour >= 5 && hour <= 7) { pattern.morningAvg += moisture; morningCount++; } else if (hour >= 12 && hour <= 14) { pattern.middayAvg += moisture; middayCount++; } else if (hour >= 18 && hour <= 20) { pattern.eveningAvg += moisture; eveningCount++; } else if (hour >= 22 || hour <= 4) { pattern.nightAvg += moisture; nightCount++; } } if (morningCount > 0) pattern.morningAvg /= morningCount; if (middayCount > 0) pattern.middayAvg /= middayCount; if (eveningCount > 0) pattern.eveningAvg /= eveningCount; if (nightCount > 0) pattern.nightAvg /= nightCount; Serial.println("📊 DAILY PATTERN DETECTED:"); Serial.printf(" 🌅 Morning (5-7 AM): %.1f%%\n", pattern.morningAvg); Serial.printf(" ☀️ Midday (12-2 PM): %.1f%%\n", pattern.middayAvg); Serial.printf(" 🌙 Evening (6-8 PM): %.1f%%\n", pattern.eveningAvg); Serial.printf(" 🌃 Night (10 PM-4 AM): %.1f%%\n", pattern.nightAvg); // Calculate daily drop float dailyDrop = pattern.morningAvg - pattern.eveningAvg; if (dailyDrop > 15) { Serial.println(" ⚠️ Large daily moisture drop (>15%) - Increase irrigation!"); } else if (dailyDrop < 2) { Serial.println(" ✅ Very small daily drop - Normal evaporation"); } } // ========== DETECT WEEKLY PATTERN ========== void detectWeeklyPattern() { if (dataCount < 168) return; // Need 7 days of data float dayAvg[7] = {0}; int dayCount[7] = {0}; // Analyze last 7 days for (int i = 0; i < 168; i++) { int day = (i / 24) % 7; float moisture = soilHistory[(dataIndex - 1 - i + MAX_HOURS) % MAX_HOURS]; dayAvg[day] += moisture; dayCount[day]++; } for (int d = 0; d < 7; d++) { if (dayCount[d] > 0) dayAvg[d] /= dayCount[d]; } Serial.println("📅 WEEKLY PATTERN DETECTED:"); const char* days[] = {"Sun", "Mon", "Tue", "Wed", "Thu", "Fri", "Sat"}; for (int d = 0; d < 7; d++) { Serial.printf(" %s: %.1f%%\n", days[d], dayAvg[d]); } // Check for weekend irrigation gap float weekendAvg = (dayAvg[0] + dayAvg[6]) / 2; // Sun + Sat float weekdayAvg = (dayAvg[1] + dayAvg[2] + dayAvg[3] + dayAvg[4] + dayAvg[5]) / 5; if (weekendAvg < weekdayAvg - 10) { Serial.println(" ⚠️ Weekend irrigation gap detected! Monday moisture significantly lower."); Serial.println(" 💡 Action: Automate weekend irrigation or adjust schedule."); } } // ========== ANOMALY DETECTION ========== void detectAnomalies(float currentMoisture) { if (dataCount < 24) return; float avg24h = calculateMovingAverage(soilHistory, 24); if (avg24h <= 0) return; float deviation = abs(currentMoisture - avg24h); float percentDeviation = (deviation / avg24h) * 100; if (percentDeviation > 30) { Serial.println("🚨 ANOMALY DETECTED! Current reading deviates >30% from 24-hour average!"); Serial.printf(" Current: %.1f%% | 24h Avg: %.1f%% | Deviation: %.1f%%\n", currentMoisture, avg24h, percentDeviation); Serial.println(" 🔍 Possible causes: Sensor failure, water leak, flooding, or sensor moved."); } } // ========== TREND DETECTION ========== void detectTrend() { if (dataCount < 6) return; float shortAvg = calculateMovingAverage(soilHistory, 3); // Last 3 readings float longAvg = calculateMovingAverage(soilHistory, 12); // Last 12 readings (3 hours) if (shortAvg > longAvg * 1.05) { Serial.println("📈 TREND: Soil moisture INCREASING (getting wetter)"); if (shortAvg > 70) { Serial.println(" ⚠️ Approaching over-watering - Consider reducing irrigation."); } } else if (shortAvg < longAvg * 0.95) { Serial.println("📉 TREND: Soil moisture DECREASING (drying out)"); if (shortAvg < 35) { Serial.println(" ⚠️ Nearing dry threshold - Plan irrigation."); } } else { Serial.println("➡️ TREND: Soil moisture STABLE"); } } // ========== PREDICT NEXT VALUE ========== float predictNextValue() { if (dataCount < 6) return -1; // Simple linear extrapolation using last 6 readings float sumX = 0, sumY = 0, sumXY = 0, sumX2 = 0; int n = min(6, dataCount); for (int i = 0; i < n; i++) { float x = i + 1; float y = soilHistory[(dataIndex - 1 - i + MAX_HOURS) % MAX_HOURS]; sumX += x; sumY += y; sumXY += x * y; sumX2 += x * x; } float slope = (n * sumXY - sumX * sumY) / (n * sumX2 - sumX * sumX); float intercept = (sumY - slope * sumX) / n; // Predict next value (x = 0) float nextValue = intercept; return nextValue; } // ========== MAIN FUNCTIONS ========== void setup() { Serial.begin(115200); pinMode(SOIL_PIN, INPUT); Serial.println("========================================"); Serial.println("📊 FARM DATA PATTERN DETECTION SYSTEM"); Serial.println(" Identify trends, cycles, and anomalies"); Serial.println("========================================\n"); } void loop() { int moisture = readSoilMoisture(); int currentHour = (millis() / 3600000) % 24; // Store data soilHistory[dataIndex] = moisture; dataIndex = (dataIndex + 1) % MAX_HOURS; if (dataCount < MAX_HOURS) dataCount++; // Display current reading Serial.println("━━━━━━━━━━━━━━━━━━━━━━━━━━━━━━━━━━━━━━━━━━━━━"); Serial.printf("🕐 Time: %02d:00\n", currentHour); Serial.printf("💧 Current soil moisture: %d%%\n", moisture); // Run pattern detection detectAnomalies(moisture); detectTrend(); // Run daily analysis at 7 AM if (currentHour == 7) { detectDailyPattern(); detectWeeklyPattern(); float nextValue = predictNextValue(); if (nextValue > 0) { Serial.printf("🔮 Predicted moisture next hour: %.1f%%\n", nextValue); } } Serial.println("━━━━━━━━━━━━━━━━━━━━━━━━━━━━━━━━━━━━━━━━━━━━━\n"); delay(3600000); // Read every hour }
📱 Real-Time Dashboard Visualization
/* * Send pattern data to OceanRemote dashboard * Visualize trends and get alerts */ #include#include const char* ssid = "YOUR_WIFI"; const char* password = "YOUR_PASSWORD"; const char* token = "YOUR_DEVICE_TOKEN"; void sendPatternData(float moisture, float trend, float prediction) { if (WiFi.status() != WL_CONNECTED) return; HTTPClient http; http.begin("https://api.oceanremote.net/device/state"); http.addHeader("Content-Type", "application/x-www-form-urlencoded"); String data = "token=" + String(token); data += "&soil_moisture=" + String(moisture); data += "&trend=" + String(trend); data += "&prediction=" + String(prediction); data += "&pattern_detected=true"; http.POST(data); http.end(); }
📊 Case Study - Pattern Detection Saves Tomato Crop:
A Moroccan tomato farmer used pattern detection to identify a hidden problem:
- 📈 Pattern: Soil moisture was dropping 25% daily (normal is 8-12%)
- 🔍 Investigation: Found underground pipe leak losing 5,000L/hour
- 💰 Savings: Fixed leak → saved 120,000L/day, $500/month
- 🌱 Result: Tomatoes recovered, yield increased 35%
"Without pattern detection, we would have kept watering more and never found the leak." - Farm owner, Morocco
💡 Pro Tips for Pattern Detection:
- 📍 Start simple: Track daily min/max and look for abnormalities
- 📍 Use baseline data: Collect 1-2 weeks of data before setting thresholds
- 📍 Multiple sensors: Patterns across zones reveal systemic issues
- 📍 Visualize: Plot data to see patterns your eyes can detect instantly
- 📍 Automate alerts: Get notifications when patterns break
🎉 Congratulations!
You can now identify and act on farm data patterns!
- ✅ Detect daily temperature and moisture cycles
- ✅ Use moving averages to smooth noisy data
- ✅ Identify weekly patterns (weekend irrigation gaps)
- ✅ Detect anomalies before they become disasters
- ✅ Predict future conditions from historical patterns
📋 Quick Reference - Pattern Recognition Cheat Sheet:
┌─────────────────────────────────────────────────────────────────────────────┐
│                      WHAT TO LOOK FOR IN YOUR FARM DATA                     │
├─────────────────────────────────────────────────────────────────────────────┤
│                                                                             │
│  🌡️ TEMPERATURE PATTERNS:                                                  │
│     • Min temp: Sunrise (6-7 AM)                                           │
│     • Max temp: 2-4 PM                                                      │
│     • Normal daily range: 8-15°C difference                                │
│     • ALERT: Night temp > 25°C = pollination problems                     │
│                                                                             │
│  💧 SOIL MOISTURE PATTERNS:                                                 │
│     • Normal daily drop: 5-15%                                             │
│     • Post-rain recovery: Should stay above threshold 3-7 days             │
│     • ALERT: Drop > 20% daily = leak or extreme heat                       │
│                                                                             │
│  📅 WEEKLY PATTERNS:                                                        │
│     • Monday moisture lower = weekend irrigation gap                       │
│     • ALERT: Day-to-day variation > 30% = inconsistent watering            │
│                                                                             │
│  🚨 ANOMALIES (Investigate Immediately):                                    │
│     • Sudden 50%+ moisture drop within 2 hours                             │
│     • Temperature spike 10°C above normal                                  │
│     • Readings stuck at same value for hours                               │
│     • Night values same as day values                                      │
│                                                                             │
└─────────────────────────────────────────────────────────────────────────────┘
💡 Key Takeaways:
- Apply these concepts directly to your farm or project.
- Take notes on important details for the quiz.
- Use the button below to track your progress.
×
![Enlarged view]()