← Back to Course
Decision Making - Part 1
🎯 Making Data-Driven Farm Decisions - From Sensors to Action
🎯 What You'll Learn:
- 📊 Convert sensor data into actionable farm decisions
- 💧 Know exactly when to water, plant, and harvest
- 💰 Calculate ROI of your IoT system (water savings + yield increase)
- 🔧 Diagnose equipment problems before they cause crop loss
Data alone is useless without action. The power of IoT comes from turning numbers into decisions that save water, increase yields, and reduce labor. This lesson teaches you how to interpret sensor data and make the right call every time.
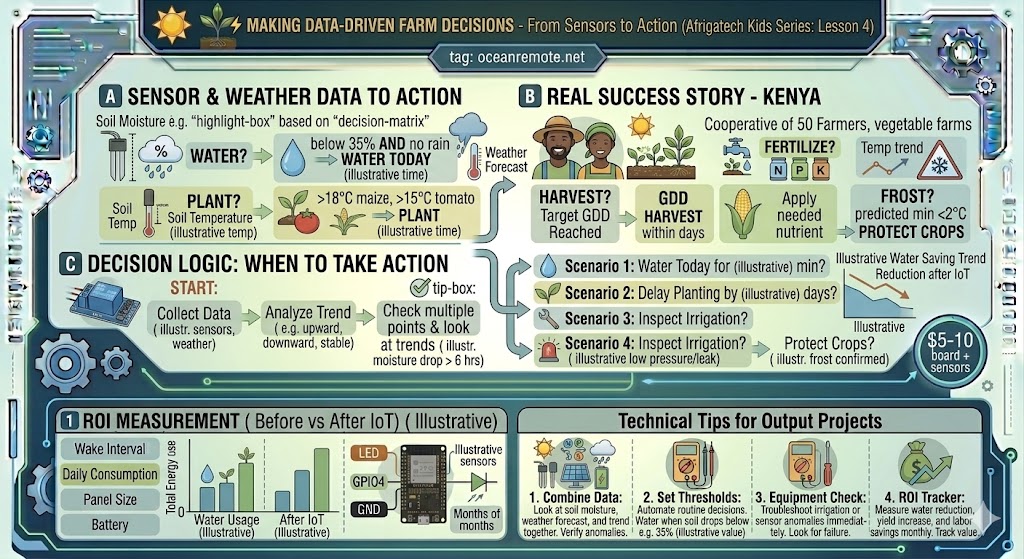
📊 Decision Matrix: When to Take Action
| Situation | Data to Check | Threshold | Decision |
|---|---|---|---|
| 💧 Should I water? | Soil moisture + Rain forecast | Moisture < 35% AND no rain | ✅ WATER for 10-15 min |
| 🌱 Should I plant? | Soil temperature (10cm depth) | > 18°C for maize, > 15°C for tomatoes | ✅ PLANT if warm enough |
| 🌾 Harvest timing? | GDD (Growing Degree Days) | Reached crop-specific GDD target | ✅ HARVEST within 3-5 days |
| 🧪 Apply fertilizer? | NPK sensor readings | N < 30 ppm OR P < 15 ppm OR K < 150 ppm | ✅ APPLY deficient nutrient |
| 🚨 Frost risk? | Temperature trend (8 PM - 6 AM) | Predicted min < 2°C | 🚨 PROTECT crops immediately |
💡 The Golden Rule:
Never make decisions based on a single reading! Always look at trends - is moisture dropping, rising, or stable? A single low reading might be a sensor error, but a downward trend over 6 hours is a real problem.
🌾 Real-World Decision Scenarios
📋 Scenario 1: Should I water today?
- 💧 Soil moisture: 28% → YES, below 35% threshold
- 🌧️ Rain forecast (24h): 0% chance → YES, no rain coming
- 🌡️ Temperature: 32°C → YES, high evaporation expected
- 🎯 Decision: WATER TODAY for 15 minutes
🌱 Scenario 2: Should I delay planting?
- 🌡️ Soil temperature (10cm depth): 12°C → Too cold for maize (needs 18°C+)
- 📈 10-day temperature forecast: Warming trend to 22°C → Wait 1 week
- 💧 Soil moisture: 65% → Perfect for germination
- 🎯 Decision: DELAY PLANTING by 7 days
🔧 Scenario 3: Is my irrigation system working correctly?
- 📊 Moisture trend: After 15 min watering, moisture rose from 28% to 45%
- ✅ Expected: Should reach 60-70% based on historical data
- 🔍 Possible issues: Low water pressure, clogged emitters, or leak
- 🎯 Decision: INSPECT IRRIGATION SYSTEM today
- 📝 Action: Check pressure gauge, flush filters, inspect drip lines
🚨 Scenario 4: Frost warning - protect crops?
- 🌡️ Current temperature (8 PM): 8°C, dropping 2°C per hour
- 🔮 Predicted minimum (6 AM): -2°C → FROST CONFIRMED
- 🌾 Crop stage: Flowering (very sensitive to frost)
- 🎯 Decision: PROTECT CROPS immediately
- 📝 Action: Cover with row covers, irrigate before dawn (water releases heat)
📈 Measuring Your ROI (Return on Investment)
Track these metrics before and after installing your IoT system to see the real value:
| Metric | Before IoT | After IoT | Typical Improvement |
|---|---|---|---|
| 💧 Water usage (liters/week) | 10,000 L | 6,000-7,000 L | ✅ 30-40% reduction |
| 🌾 Crop yield (kg/season) | 500 kg | 600-650 kg | ✅ 20-30% increase |
| ⏰ Labor hours (watering/week) | 10 hours | 2 hours | ✅ 80% reduction |
| 💰 Water cost ($/month) | $50 | $30-35 | ✅ $15-20 saved |
🎯 Key Takeaways:
- ✅ Always combine multiple data points before deciding (moisture + weather + trend)
- ✅ Use thresholds to automate routine decisions (water when below 35%)
- ✅ Investigate anomalies immediately - they often indicate equipment failure
- ✅ Track ROI metrics monthly to see the value of your system
- ✅ Document your decisions and outcomes to improve future decisions
💡 Key Takeaways:
- Apply these concepts directly to your farm or project.
- Take notes on important details for the quiz.
- Use the button below to track your progress.
×
![Enlarged view]()