← Back to Course
Data Analysis - Part 1
📊 Turning Raw Data into Farm Insights - From Numbers to Knowledge
📊 What You'll Learn:
- 🔍 Interpret raw sensor readings to understand farm conditions
- 📈 Identify normal patterns vs. problems (leaks, equipment failure)
- 📊 Create reports to track week-over-week improvements
- 💰 Turn data into decisions that save water and increase yields
Raw sensor readings like "3820" or "28°C" are just numbers until you interpret them. This lesson teaches you how to transform data into actionable insights.
💧 Soil Moisture Analysis
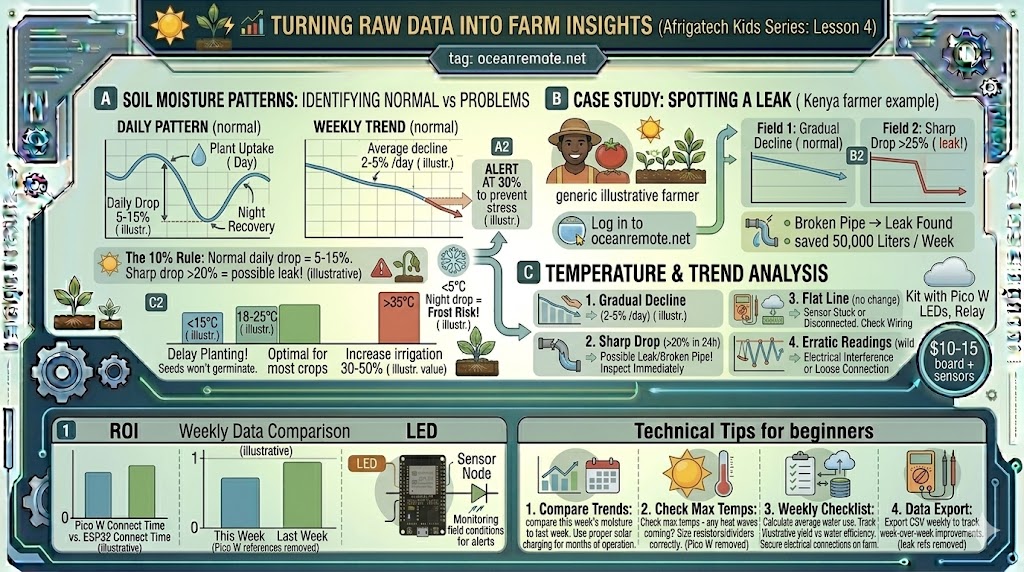
- Daily Pattern: Moisture drops during the day (plant uptake), recovers at night. Normal drop = 5-15%.
- Weekly Trend: Gradual decline of 2-5% per day = normal usage. Sharp drop > 20% = possible leak.
- Alert Threshold: Set alert at 30% to water before plant stress.
💡 The 10% Rule:
Normal daily moisture drop = 5-15%. If drop exceeds 20% daily, investigate possible leak. If drop is less than 3%, your soil may be waterlogged.
📖 Case Study - Spotting a Leak:
A farmer noticed soil moisture dropping from 65% to 40% overnight (25% drop). Investigation found a broken pipe. Fixing it saved 50,000 liters per week.
🌡️ Temperature Analysis
- Soil temperature below 15°C: Delay planting - seeds won't germinate properly
- Soil temperature 18-25°C: Optimal for most crops
- Air temperature > 35°C: Increase irrigation frequency by 30-50%
- Night temperature drops < 5°C: Frost risk - cover crops or irrigate before dawn
📈 Weekly Trend Analysis
- Gradual decline (2-5% per day): Normal usage - maintain schedule
- Sharp drop (> 20% in 24h): Possible leak or broken pipe - inspect immediately
- Flat line (no change): Sensor may be stuck or disconnected - check wiring
- Erratic readings (wild swings): Electrical interference or loose connection
📊 Exporting Data for Reports
- Go to OceanRemote dashboard → Device History
- Select date range (e.g., last 7 days)
- Click "Export CSV"
- Open in Excel or Google Sheets
- Create charts: Insert → Chart → Line chart
- Add trendlines to see direction (up/down/stable)
💡 Weekly Review Checklist:
- 📊 Compare this week's moisture to last week
- 🌡️ Check max temperatures - any heat waves coming?
- 💧 Calculate average daily water use - trending up or down?
- 📈 Track yield vs water used - is efficiency improving?
🎯 Key Takeaways:
- ✅ Normal daily moisture drop = 5-15%
- ✅ Sharp drops > 20% = possible leak or equipment failure
- ✅ Soil temp < 15°C = delay planting
- ✅ Air temp > 35°C = increase irrigation 30-50%
- ✅ Export CSV data weekly to track improvements
💡 Key Takeaways:
- Apply these concepts directly to your farm or project.
- Take notes on important details for the quiz.
- Use the button below to track your progress.
×
![Enlarged view]()